| |
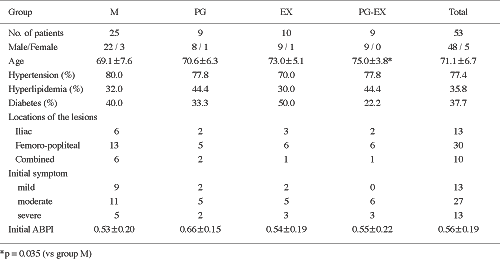 |
| Table 1 |
Characteristics of patients in each group with conservative
therapy |
|
| |
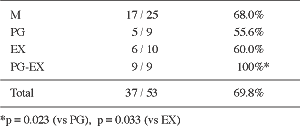 |
| Table 2 |
The percentages of improvement on the symptoms in each group |
|
| |
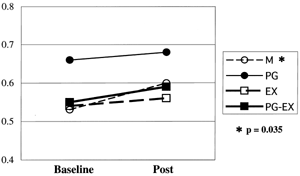 |
| Fig. 1 |
ABPI at baseline and post-treatment |
|
| |
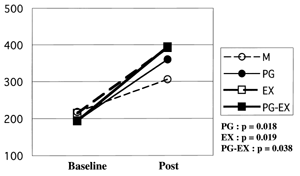 |
| Fig. 2 |
Maximum walking distance at baseline and post-treatment |
|
| |
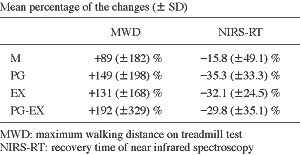 |
| Table 3 |
The changed rates of the data on MWD and NIRS-RT in each group |
|
| |
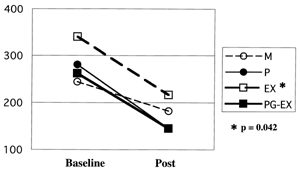 |
| Fig. 3 |
Recovery time of NIRS at baseline and post-treatment |
|
| |
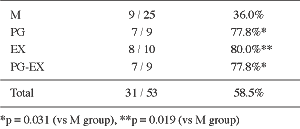 |
| Table 4 |
The general improvement rate in each group |
|
|


