| |
|
|
| Fig. 1 Preparation of the experimental model (IR group and C group) |
|
| |
| |
|
|
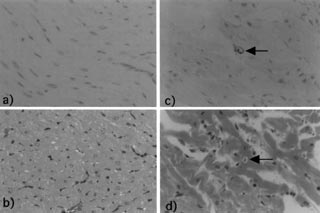
Fig. 2 IR 6h, heart
a: TUNEL method: Apoptotic cell was not observed in the control (×200) .
b: H-E staining: Pyknosis was not observed in the control (×200) .
c: TUNEL method: Apoptotic cell (←) was observed in the myocardium (×200) .
d: H-E staining: Pyknosis (←) was observed in the myocardium (×200) . |
|
| |
| |
|
|
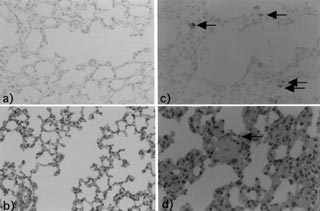
Fig. 3 IR 6h, lung
a: TUNEL method: Apoptotic cell was not observed in the control (×100) .
b: H-E staining: Pyknosis was not observed in the control (×100) .
c: TUNEL method: More apoptotic cells (←) were observed among the alveolar cells than in the C group (×200) .
d: H-E staining: The thickening of the stroma and destruction of alveolarstructure were more marked than in the C group. Pyknosis (←) was also observed (×200) . |
|
| |
| |
|
|
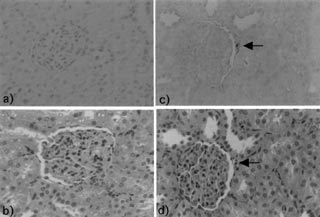
Fig. 4 IR 6h, kidney
a: TUNEL method: Apoptotic cell was not observed in the control (×200) .
b: H-E staining: Pyknosis was not observed in the control (×200) .
c: TUNEL method: Apoptotic cell (←) of renal tubular epithelium was observed (×200) .
d: H-E staining: Edema and pyknosis (←) of renal tubular epithelium were observed (×200) . |
|
| |
| |
|
|
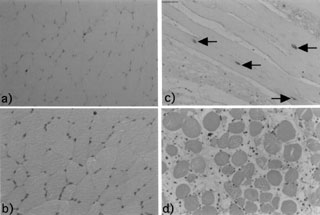
Fig. 5 IR 6h, muscle
a: TUNEL method: Apoptotic cell was not observed in the control (×100) .
b: H-E staining: Pyknosis was not observed in the contro (×100) .
c: TUNEL method: Stromal edema and apoptotic cells (←) were observed (×100) .
d: H-E staining: Stromal edema was observed (×100) . |
|
| |
| |
|
|
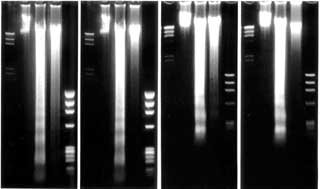
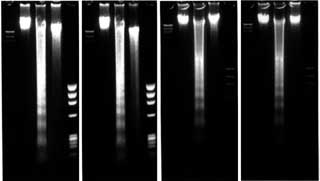
Fig. 6 Heart
Fragmentation of DNA were observed as a ladder pattern in the IR 6h and 24h groups, but not in the C group. |
|
| |
| |
|
|
Fig. 7 Lung
Fragmentation of DNA were observed as a ladder pattern in the IR 6h and 24h groups, but not in the C group. |
|
| |
| |
|
|
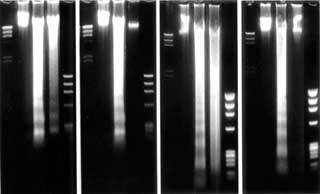
Fig. 8 Kidney
In the IR 6h and IR 24h groups, a ladder pattern was observed more marked than in the C group. |
|
| |
| |
|
|
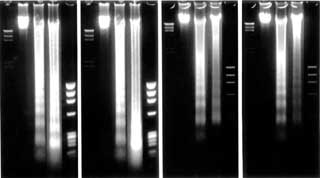
Fig. 9 Skeletal muscle
DNA fragmentation showing a ladder pattern was observed in the IR 6h group, but not in the C group. No DNA fragmentation was observed in the IR 24h or C group. |
|
| |
| |
|
|
| Fig. 10 The pathway to the onset of MNMS in acute arterial occlusion (inference) |
|
| |
|